User and behavioral models are a great way to make sense of a lot of user research data.
There are a variety of models we can use to help us in our understanding of our findings and share out our learning with the community. We are focusing on Personas to model users and Use Cases (.ppt) to model behavioral goals, needs and wants.
On this page:
Personas
Persona Scales were used to identify and describe personas. We identified 6 Faculty, 4 Student and 2 Instructional staff personas based on 20 Contextual Inquiries with users in these roles (across UC Berkeley, York University & University of Toronto). Our research is an iterative process. We were unable to meet with System Administrators and Institutional Staff in this iteration although we recognize them as an important user group.
Check out the personas that emerged from the research:
Use Cases
"A sequence of actions that takes place in a problem domain between a user and the system."
- Menlo Institute
A variety of models are being worked on with use cases as the focus. They will inform the Fluid component roadmap along with each component's functional requirements.
Affinity Diagramming
Use Case Frequency Matrix
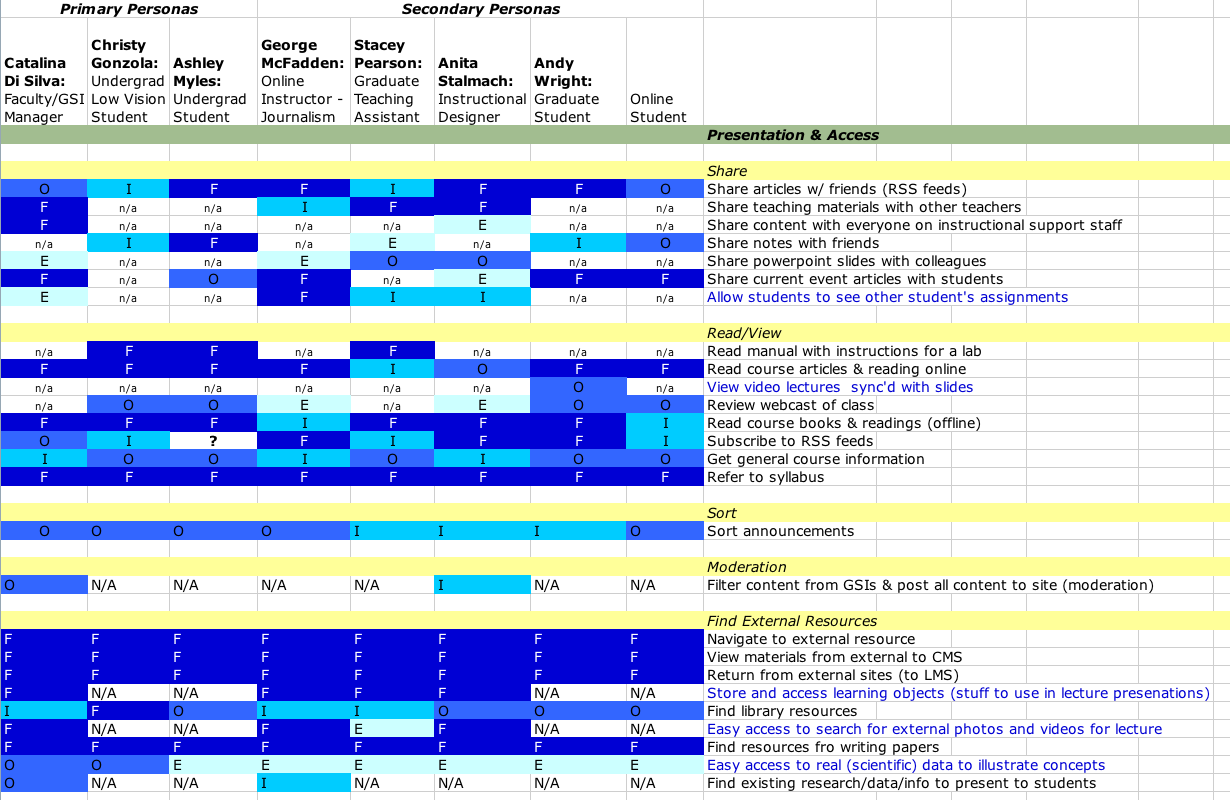
The Frequency Matrix allows us to understand who's doing what and how often.
Completed Use Case Frequency Matrix
Samples from matrix:
Use Case Priority Matrices
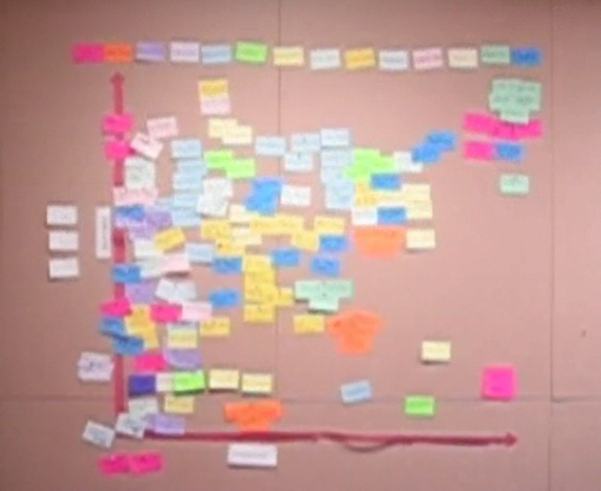
Our priority matrices will help us understand frequency and importance of use cases. Priority matrices can be used to visualize of priority attributes like technical difficulty, design and development effort and even relationships.
We will create a priority matrix for each component on the Fluid Roadmap. Here's what one might look like (borrowed from a previous Sakai project):
This matrix was created for the Sakai project. Colors indicate the functional area of the use case. Low-low is the bottom left corner. As you move up Y axis or over on the X axis the measurement gets higher.

