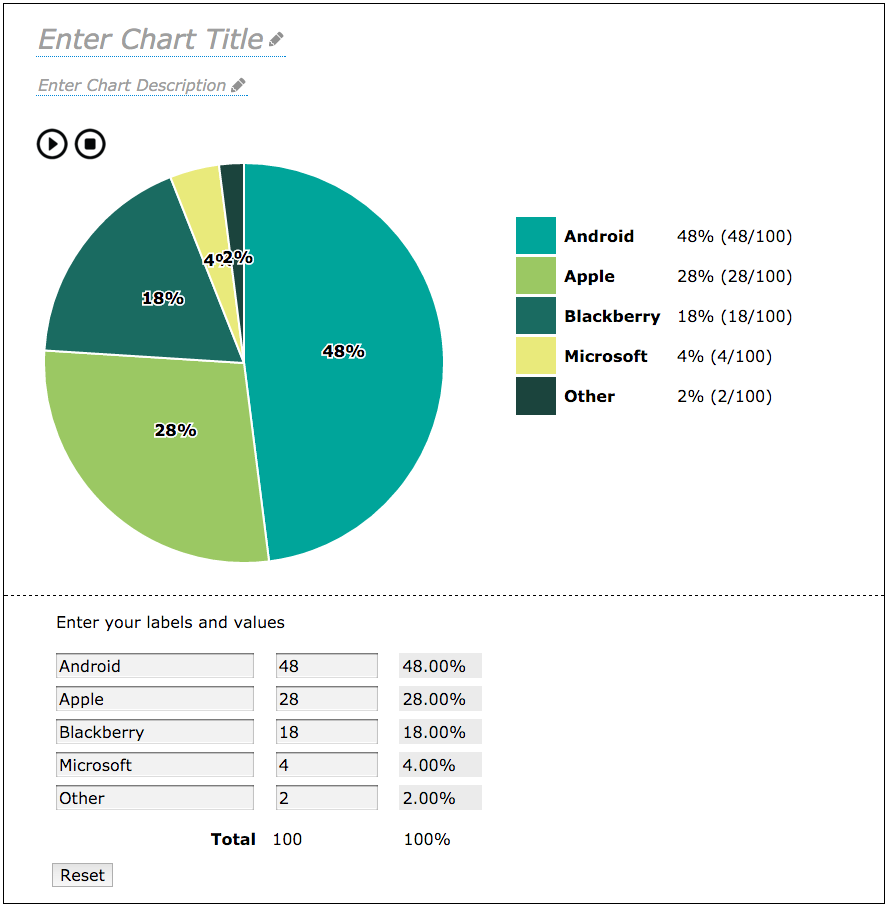
The FLOE Chart Authoring Tool - An Introduction
What Is It?
The FLOE Chart Authoring Tool is an OER authoring tool that supports the creation of highly accessible charts, including experimental conversion of chart data into representation by sound (“sonification”) as well as by visual display. Currently at the stage of a functional prototype, it is still in active development and will continue to evolve and add new features.
...
Artifacts of the process can be found through the organizing wiki page and the Github code repository. General discussion of inclusive design approaches can be found at the Inclusive Learning Design Handbook and the GPII Inclusive Design Guide.
At the code level, the tool makes use of of open source libraries including the Fluid Project’s Infusion, the Infusion-based Flocking audio synthesis library, and the D3 data visualization library. By using only open-source libraries and inherent advanced functionality of modern browsers such as speech and audio synthesis, the tool’s architecture models the same principles of openness embodied by OERs. The code is transparent, modular, modifiable and extensible by anyone who should desire.
...
