Framework Demo (wireframes)
Attached is a mockup of the framework demo UI. This is the idea of a single data set producing multiple visualizations. I've kept it as lightweight as possible.
Description of the screens:
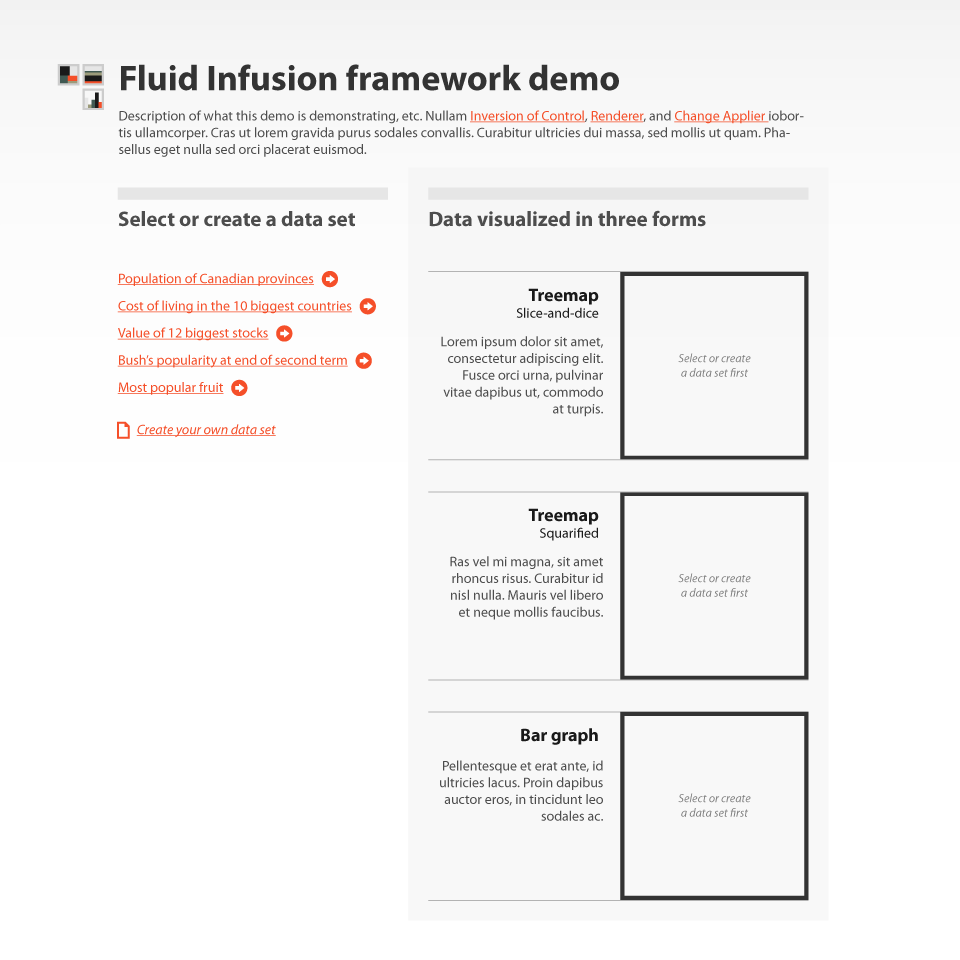
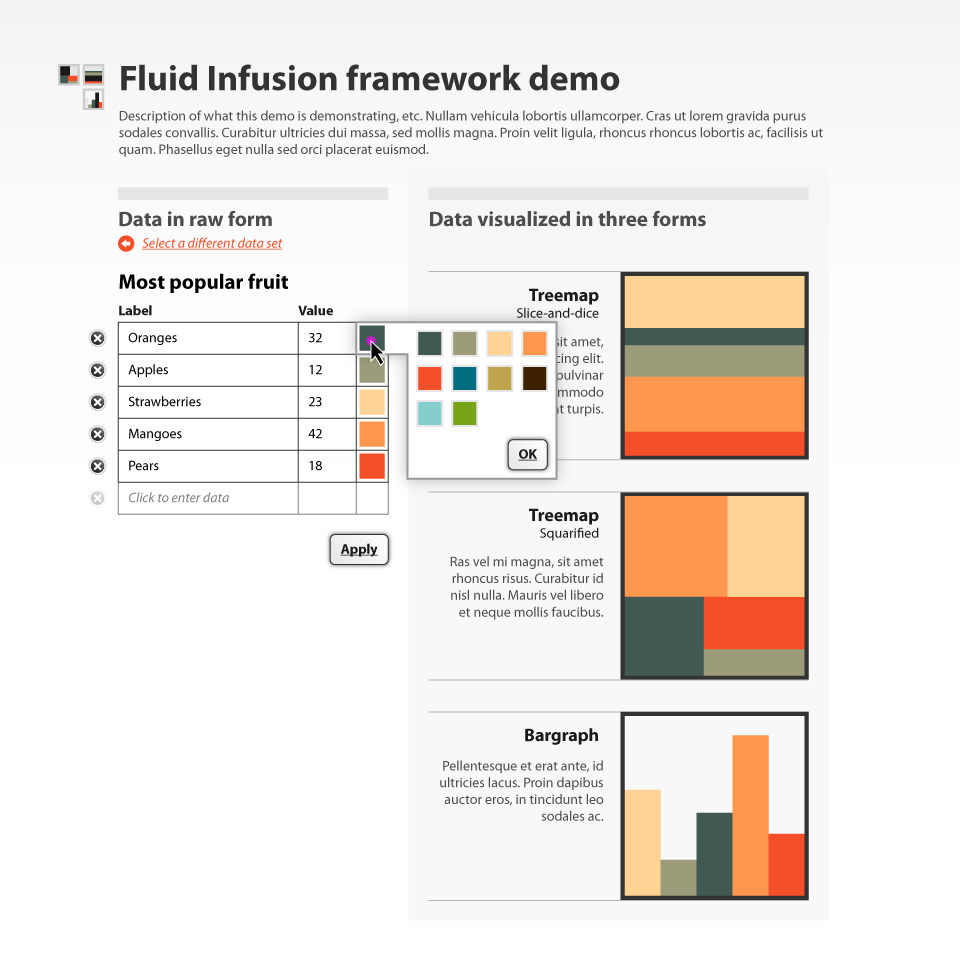
01: The initial screen. User is expected to select an existing data set or create a new one.
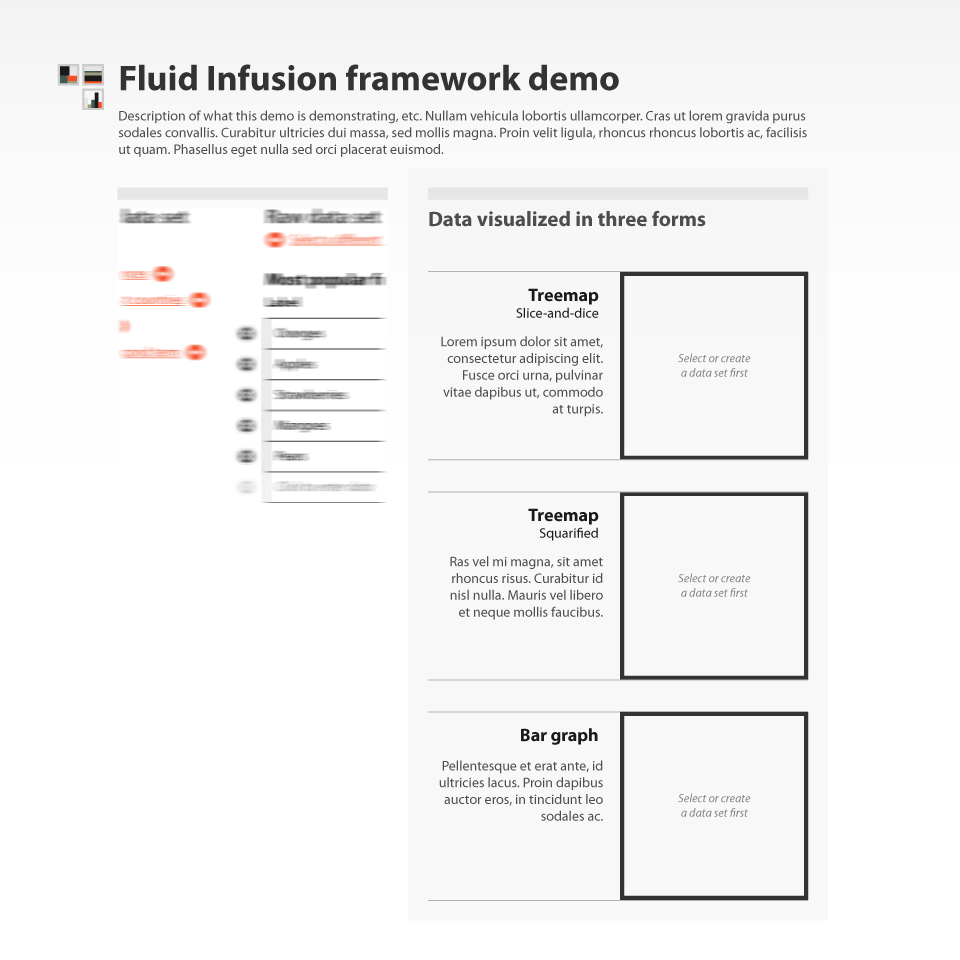
02: The left panel transitioning.
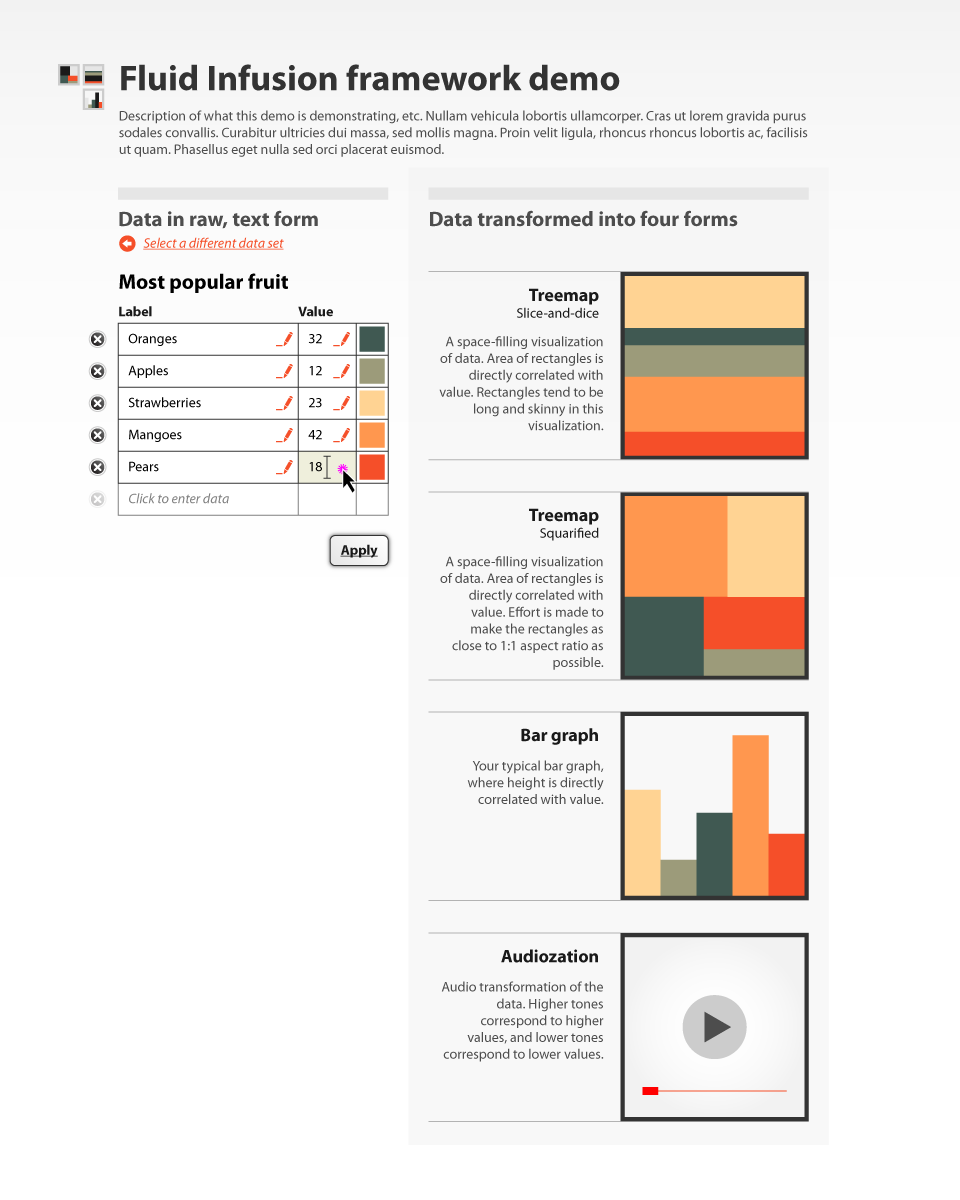
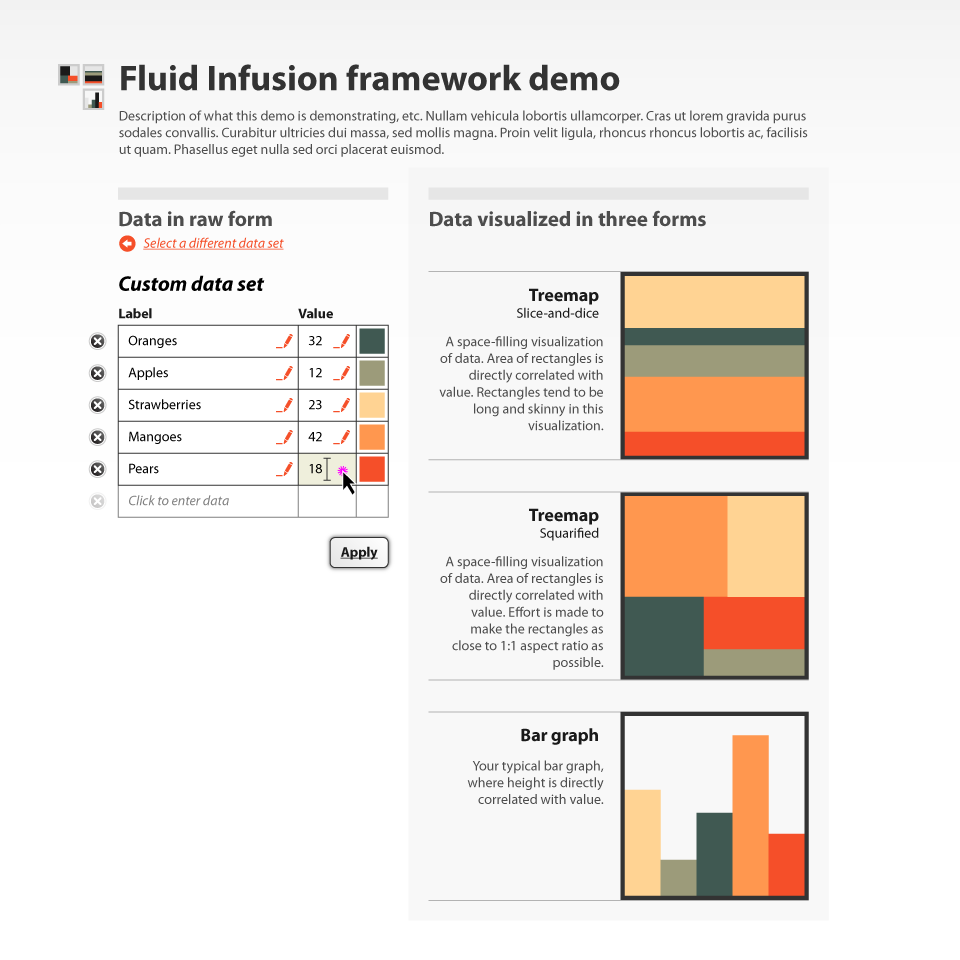
03: Data set selected. Raw data on left, data visualized on right. Key-value pairs are editable. Ideally, it'd be nice if we could update the visualizations in real-time (i.e., on edit), but if not, the user can use the "Apply" button to make things happen. (it'd also be good if we could animate the visualization changes)
03B: Nothing of interest here, except that the title says "Custom data set" in italics.
04: Colour selector. Optional. We can automatically assign colours from a pre-defined palette to new key-value pairs.

With audiozations: