Exploration and Early Sketches
- Sepideh Shahi
- Lisa Liskovoi
Owned by Sepideh Shahi
Work in progress...
General Principles:
- Consider that people have different sensitivities, give them power to change those sensitivities
- Create a tool to build multiple first class presentations (visual, sound, text) of information
- Apply principle 1 & 2 to give people the ability to choose, adapt and form their personal mappings
Sound Parameters
- Pitch
- Scale
- Timbre
- Tempo
- Rhythm
- Density
- Energy
- Harmonic relationships
- Brightness
- Roughness
- Spatial location
- Volume
- Length of time/ duration
Space of Data
- Static data e.g. diagrams, charts, etc (Please note that static data will turn into dynamic, if users are provided with means to interact with a data set and navigate in it e.g. data stream)
- Observing a dynamic system e.g. simulation
- User control/ Influencing data
- Navigation within data
- Spatially
- Temporarily
Views on the Data
- Data value as is
- Rate of change (derivative- Point within data)
- Volatility (Summary of data over time)
- Zooming in/out
- Shape vs. detail
- Outliers
Ideas:
- Build an exploration space and have users envision how to map data to audio. e.g. Tableau for data visualization.
- Exploration vs. query
- Things fusing into one sound.
Exploration - Session 1
In this session some of the common forms of static data such as a line diagram, a pie chart and a Venn diagram were explored in order to understand the followings:
- Properties that are perceived by sighted users at a glance.
- Mapping these properties to sound
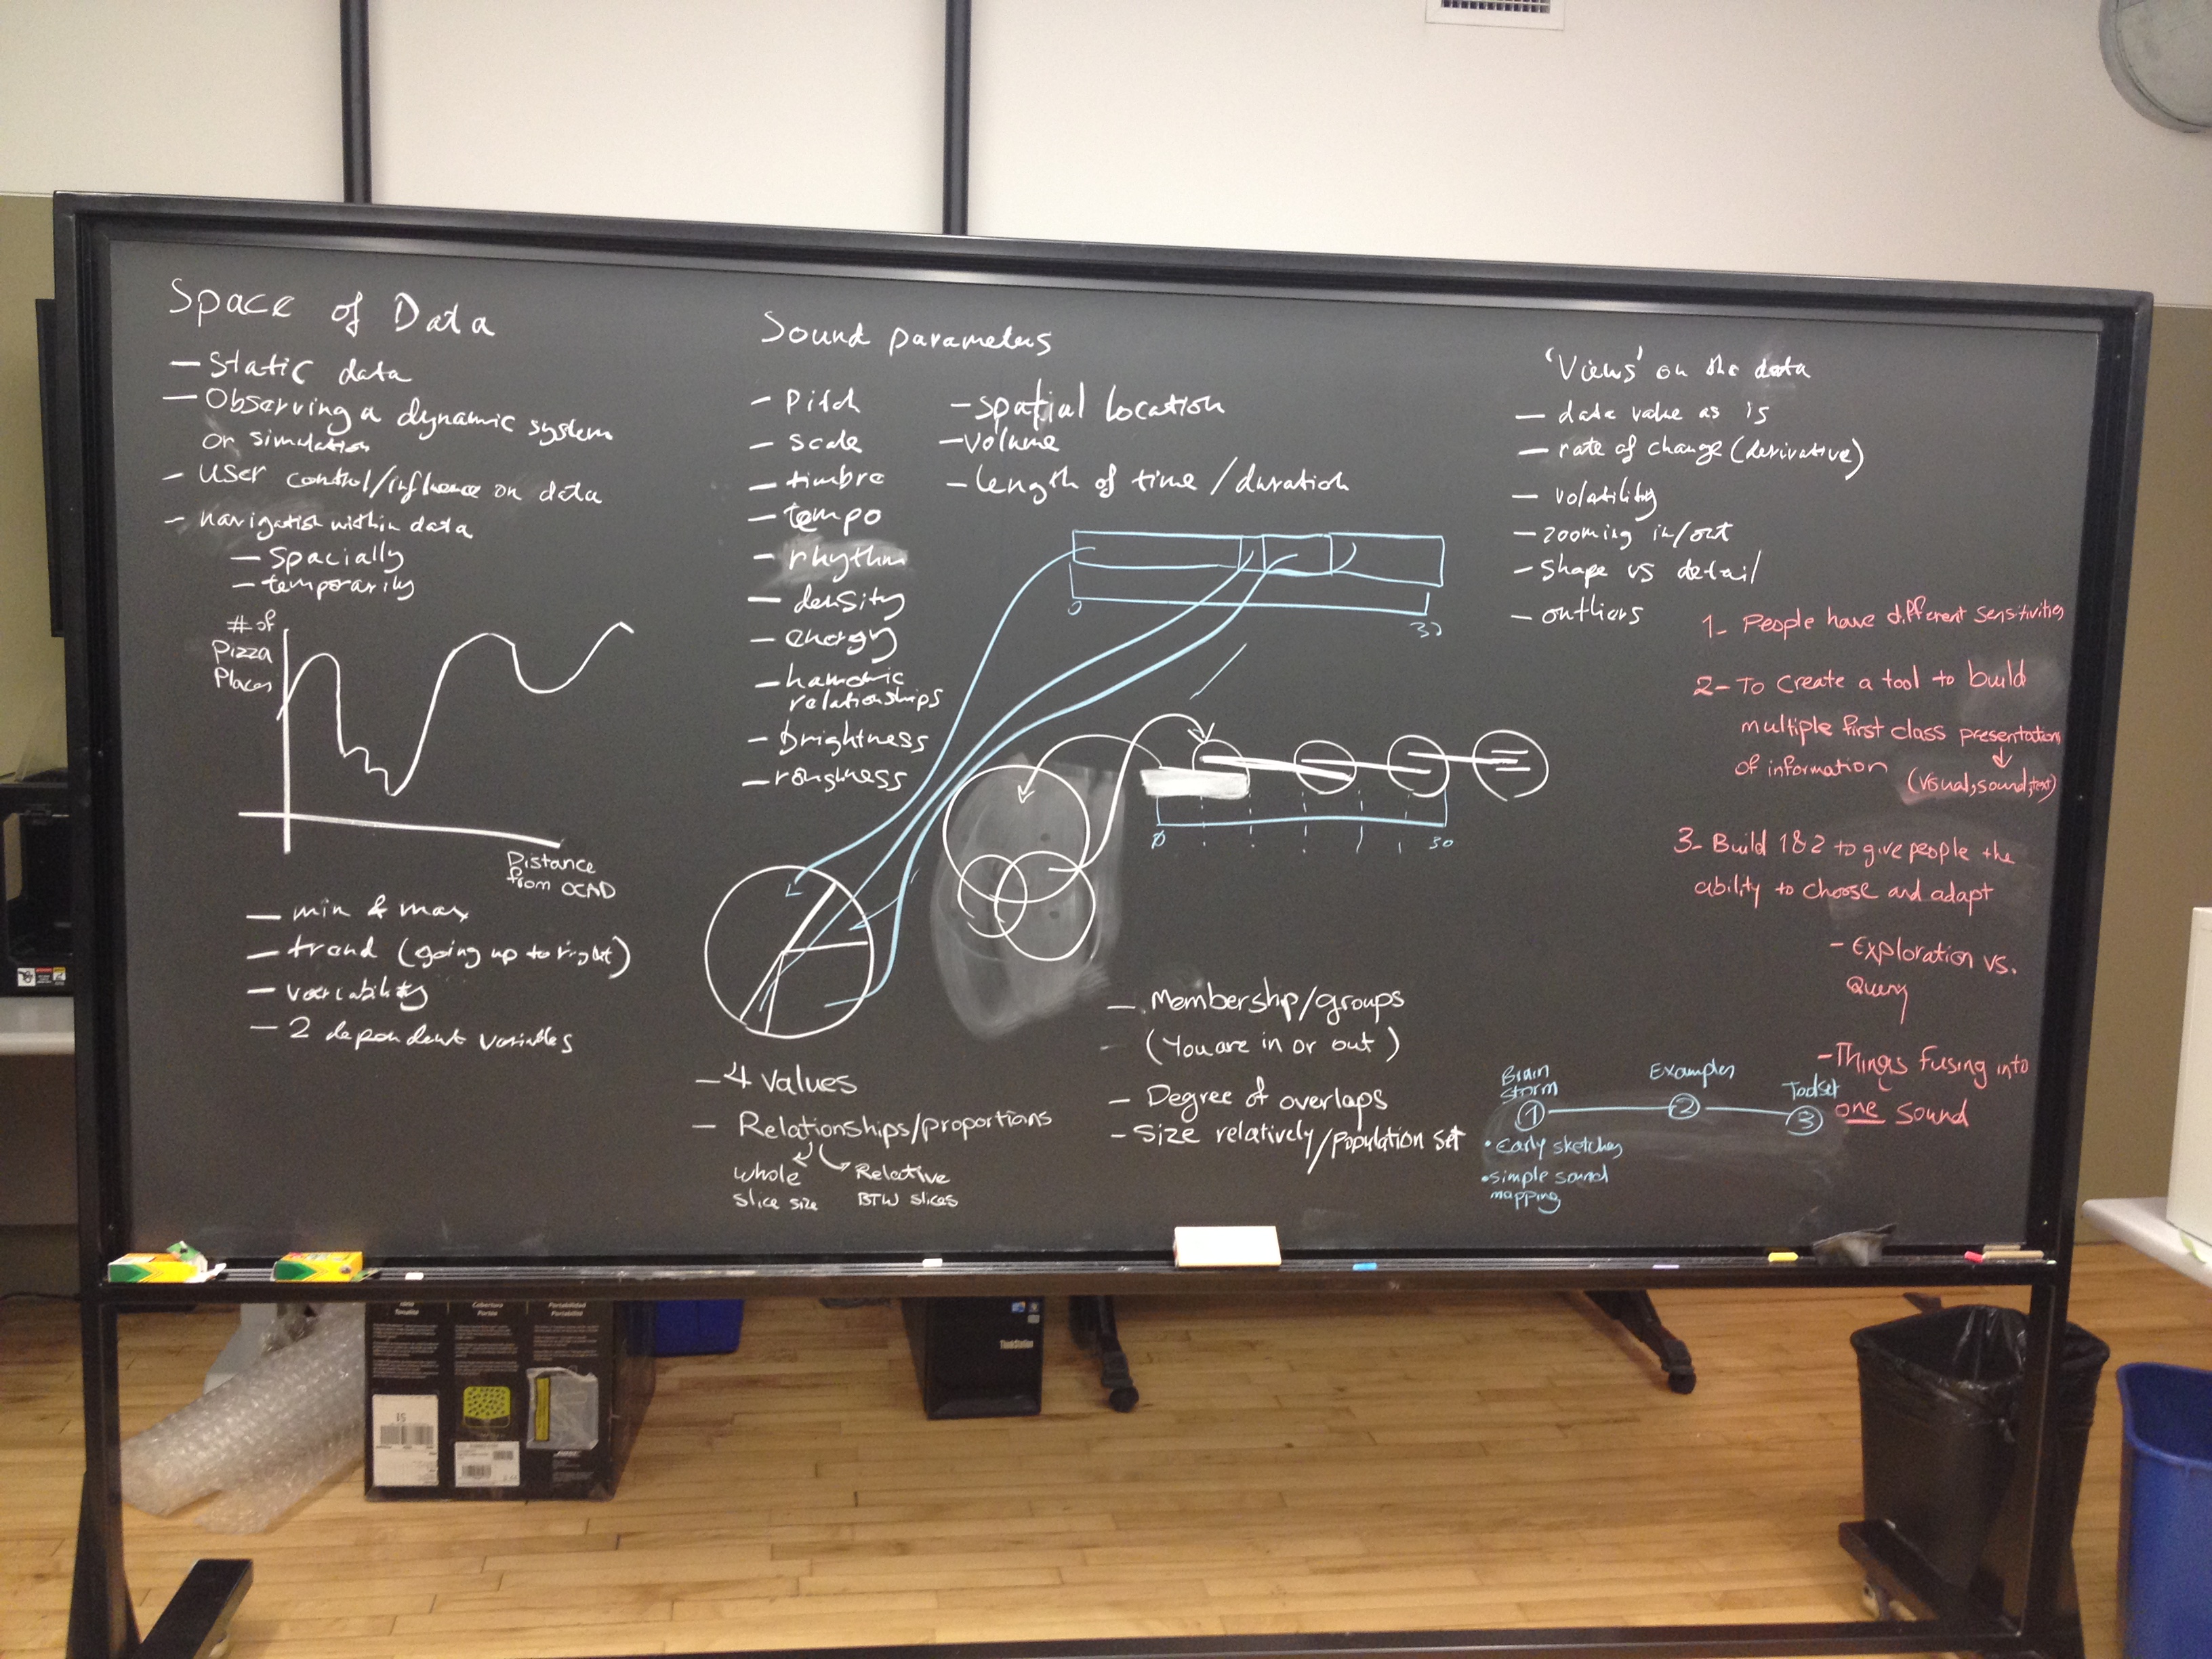
Line Graph
- Minimum and maximum points
- Trend (going up to right)
- Variability
- 2 dependent variables
Open Questions:
- Providing the same level of interaction that we have in the visual graph for sonified graphs (e.g. using two fingers to select two specific points on the graph)
- Use of spatial vs. temporal sound, specially when the variables are not time related.
- Showing exact measures or numbers
- Use of words in sonification
Pie Chart
- Number of values
- Relationships/ Proportions
- Relationship of a slice to the whole
- Relationship of a slice to other slices
Open Questions:
- Use of 4 simultaneous sounds vs. use of different durations of sound
Venn Diagram
- Membership/ Groups (either in or out of a group)
- Degree of overlaps
- Relative Size/ Population sets
Open Questions:
- Convey overlaps with multiple groups (Choir Art Installation in Ottawa)
Community Meeting Notes
March 25th, 2015
- A screen reader user should have the ability to tab to a desired section in the data set and only hear a specific part of a data set.
- If a table is presented, every time a cell is read out, the header related to that cell should be read out as well. Otherwise, the screen reader would just read a bunch of numbers that may not be meaningful to the user.
- For sonified experiences, there should be an audio legend (either in the beginning, during the experience or at the end) in order to help users decode what is being played.
- The audio legend should directly use a piece of sound that is being used in the sonified experience instead of describing it in voice. (Instead of saying the "guitar sound represents the population", play a track of guitar sound and say "this sound represents the population".
- We could use a moment of silence instead of the bell sound in sketch#2 in order to indicate the end of a section and beginning of another one.
- If we are using a unit reference sound, it should be kept steady and consistent. If a rhythm in present, it should be meaningful (ex. a downbeat representing the start of a century, every successive beat represents the beginning of a 25 year interval)
- Allow user to play around and turn things on and off.
- Frame parameters and constraints of sonification and try to understand what's the mapping space, and to what extend we allow users to participate in the mapping.
- Provide means to allow for constructive learning as well as free exploration.
- The experience is contextual, in some scenarios user should have full control to play and adjust the sonification model. In some other scenarios, authors have more control and they can provide users with some presets to choose from based on their individual needs.
- Be aware that sounds are contextual and may be different for each user. Thus, for example we should not assume that the sound of rain is familiar to all users and they can decode it easier. Provide users with different options to pick a sound category that is more relevant to their personal experiences and context.
- In addition to the visual and sound representation, the user should also be able to access the data view and explore the raw data.
Meeting Notes
April 1st, 2015
Next steps:
- Create several persons including a few students and authors (make sure to include students with partial visual impairment and blindness within the student personae)
- Try to capture their learning styles
- Apply user states and context for these users
- Create several scenarios for the pie chart and how each user can interact with it and use it
- Start writing a paper for the design method that has been used so far (Participatory design, sharing ideas in different phases with users and getting their feedback in order to unpack a design challenge and come up with new solutions and ideas and discuss features)
- Create additional sonified pie charts and different variation of the other sonic charts (include a version with an audio legend for each one)
- Check out the Edward Tufte's critism of the pie chart