Pie Chart 1
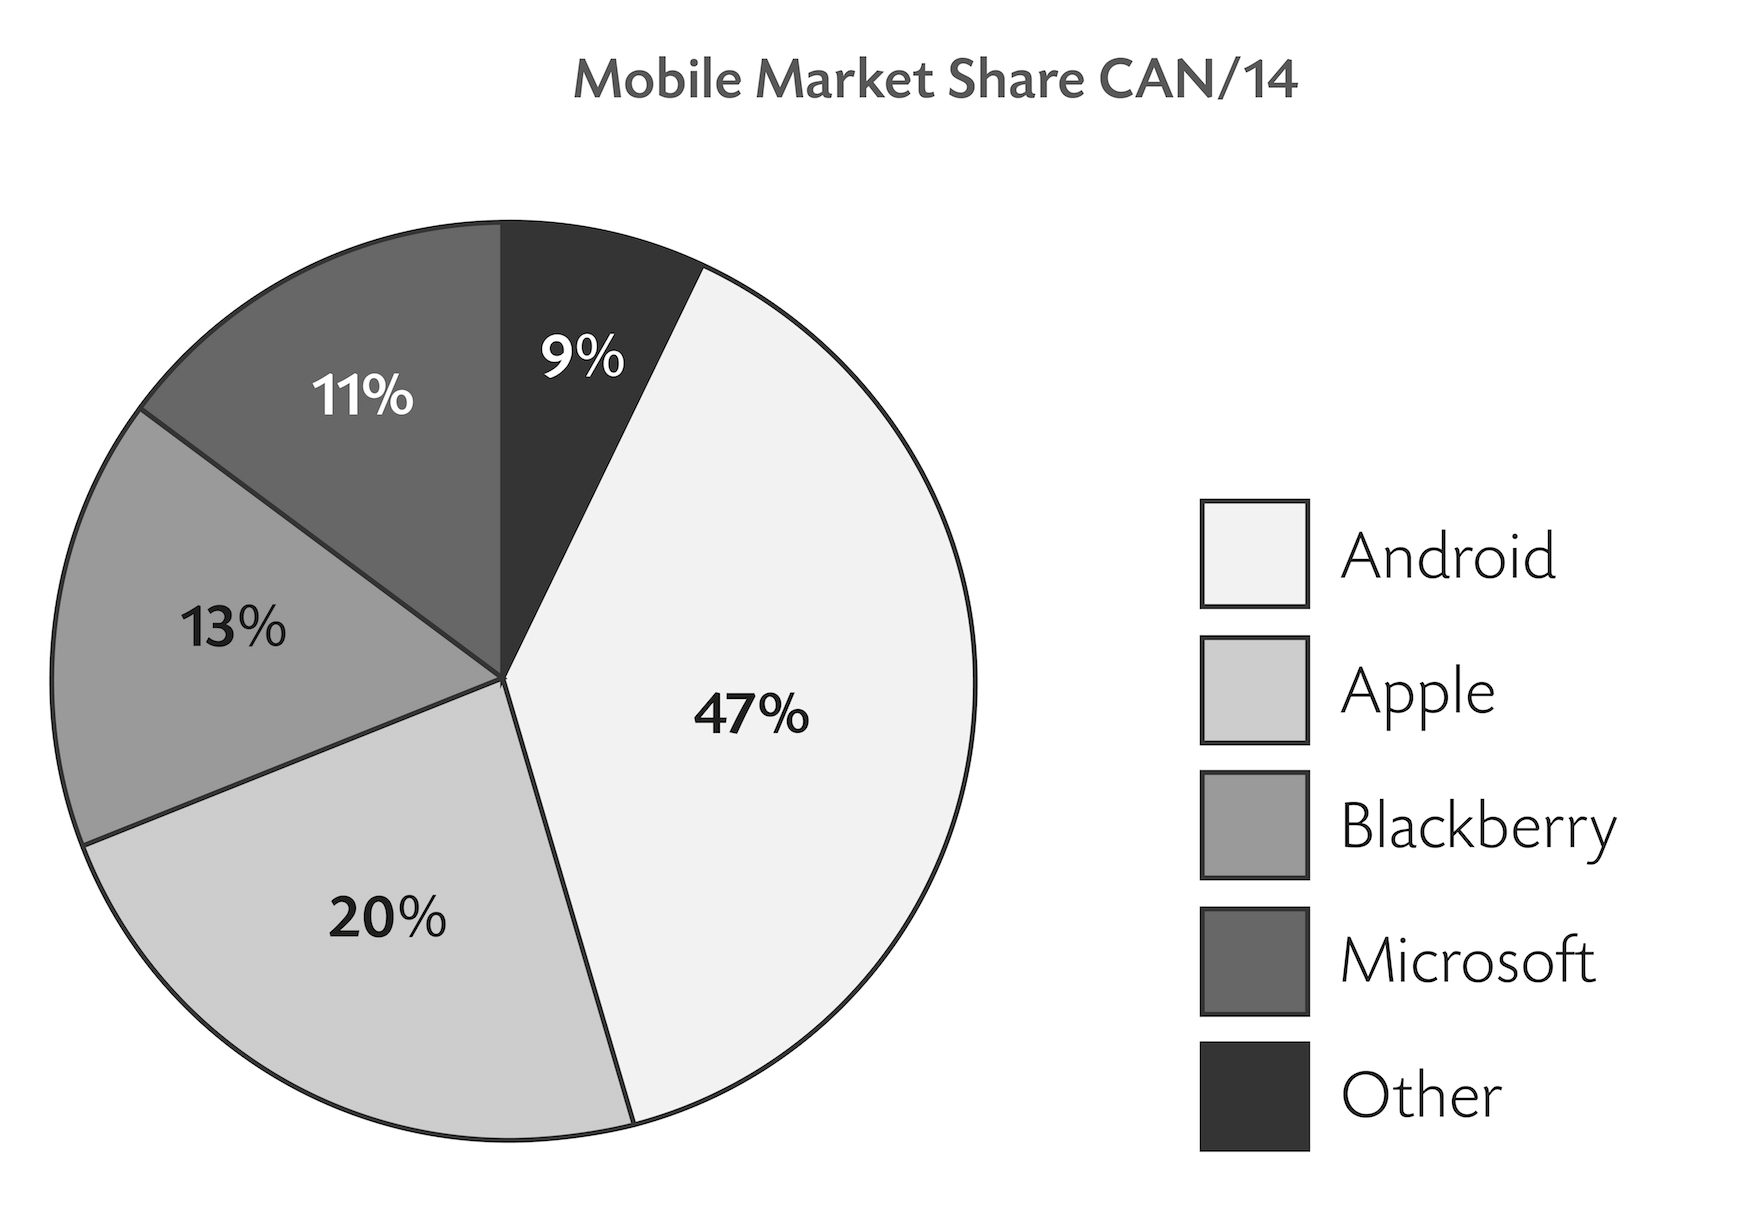
The following sonification sketches are based on the attached sketch to explore different ways of sonifying a Pie chart. Unlike the Early Sound Sketches, these ones are made based on a real pie chart and the timing of each value is very close to an accurate measure. A legend has been added to the piece. In the first sketch, the timing and values have 1:1 proportion, however, the timing has been cut into half for the rest of the sketches. Before listening please start with low volume and then adjust based on your preference. The goal is to spot the dominant Operating Systems market shares by listening to the following sketches.
Sonification-PieChart-Sketch#1-Legend.mp3
Sonification-PieChart-Sketch#2-Legend.mp3
Sonification-PieChart-Sketch#3-Legend.mp3
Sonification-PieChart-Sketch#4-Legend.mp3
Sonification-PieChart-Sketch#5-Legend.mp3
Received Feedback:
- #1 and #2 -both of these make the relative proportions really clear. Prefer not to hear a pause between the segments, since you’ve got the bell indicating the start of a segment. Remove the Bell sound all together and let the segments flow to each other. It would be easier for user to listen to segments in order.
- #3 - Difficult to differentiate between the individual sounds.
- #4 - For the shorter/smaller segments, it may be difficult to hear it over top of all the other sounds. But it is really interesting to see how it describes the relative proportions between the segments as well as each segment relative to the whole. It would be easier for user to listen to segments in order.
- #5 - This one really confusing - Couldn't tell why some segments overlap and others don’t, and in general couldn’t figure out what was happening.
Pie Chart 2
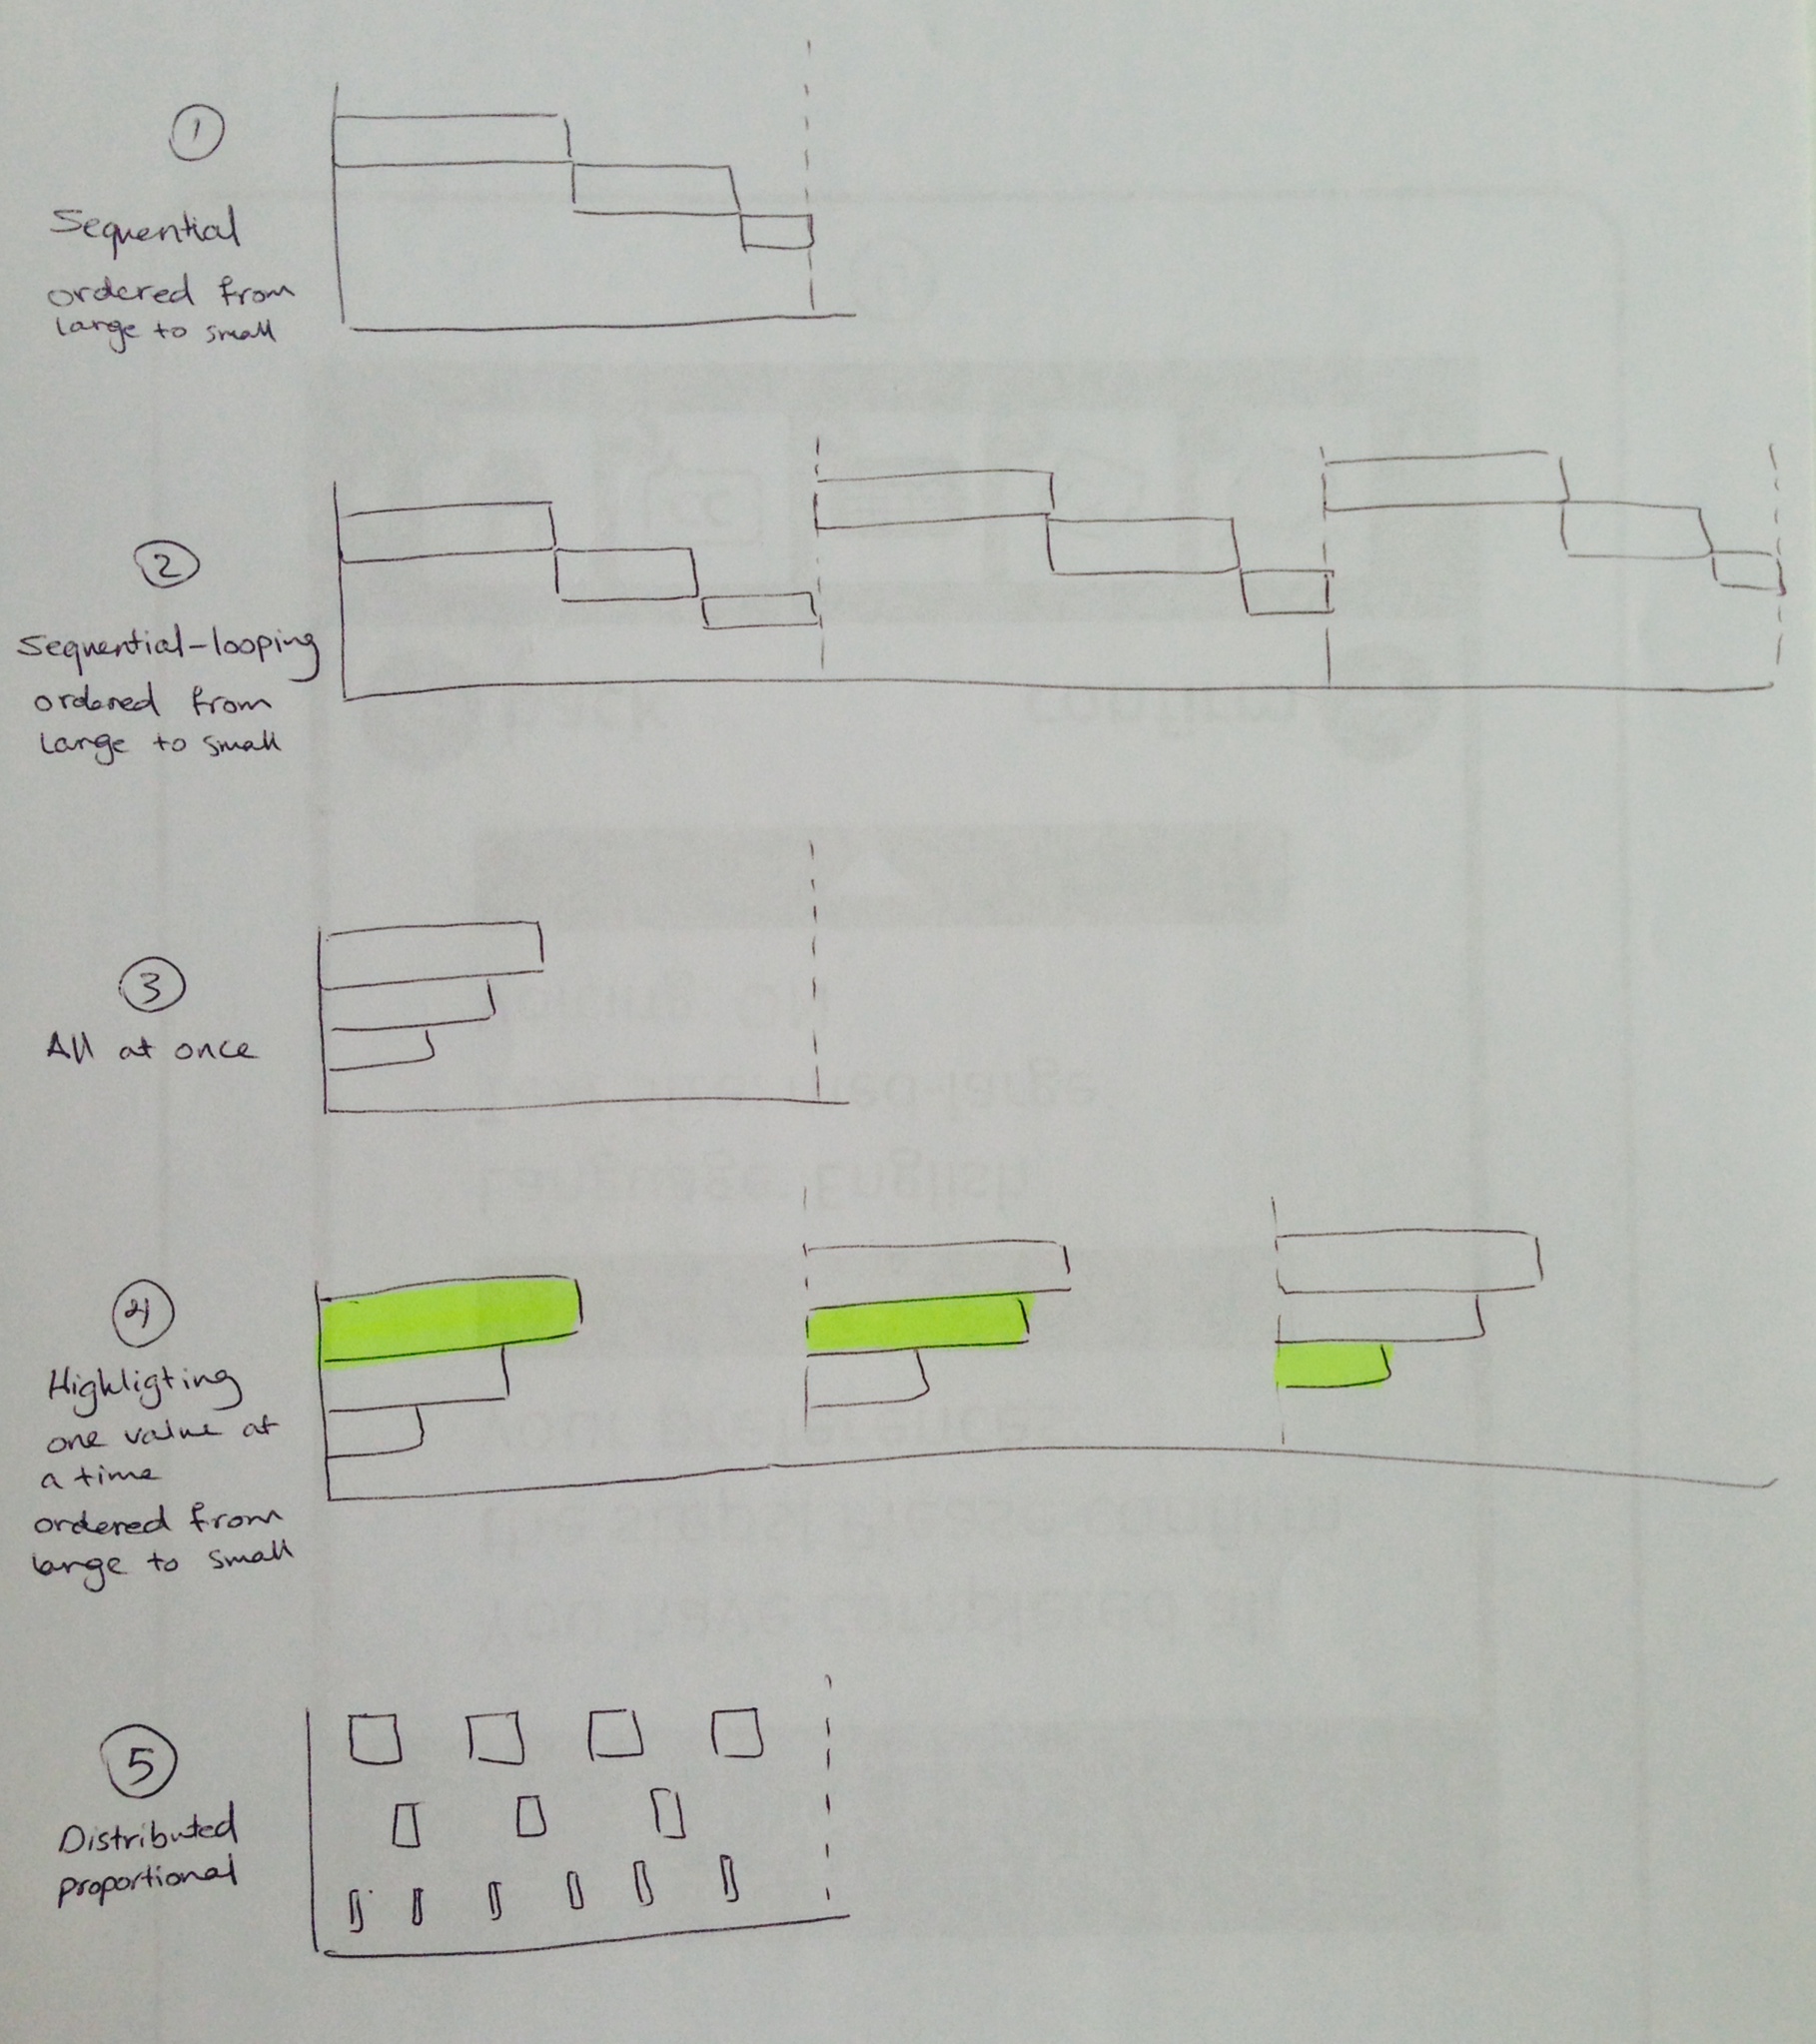
Pie Chart 2 sketches have been edited based on the feedback received from the team. The following changes have been applied:
- Sketch#1:
- The segments are ordered from large to small to make it easier for listener to spot the more dominant segments.
- The bell sound indicating start of a segment has been removed. The moment of silence between segments has been removed.
- Sketch#2:
- The segments are ordered from large to small.
- The bell sound indicating start of a segment has been removed.
- The double bell sound that indicates looping is replaced by single bell sound.
- Sketch#4:
- The Highlighted pieces are ordered from large to small.
- Sketch#5:
- sounds are split into smaller pieces and are more distributed throughout the piece.
Sonification-PieChart-Sketch#1-Legend-ordered-no bell.mp3
Sonification-PieChart-Sketch#2-Legend-ordered-no bell.mp3
Pie Chart 3
Round 3 sketches were developed based on the previous rounds’ sketches, but other features were also added. Different sounds and legend styles were used in order to reproduce the following pie chart:

Sketch #1-R3 – Audio legend is placed in the beginning; different sounds were used to represent each section, with the duration being a metaphor for size; nonstop play back.
Sketch #2-R3 – Audio legend is placed in the beginning of each section; different sounds were used to represent each section, with the duration being a metaphor for size; sectioned play back.
Sketch #3-R3 – Audio legend is placed in the beginning; only one sound is used to represent the market share, and the sections are separated by a bell sound; nonstop play back
- Sketch #3.1-R3 – Same as Sketch #3, with a metronome sound included
- Sonification-Sketch#3.1-R3.wav
- Sketch #3.2-R3 - Same as Sketch #3.1, but with the audio legend in the beginning of each section
- Sonification-Sketch#3.2-R3.wav
Sketch #4-R3 – Audio legend is placed in the beginning; only one sound is used to represent the market share, and the sections are separated by a bell sound; sounds to indicate ten units and units were added as a metaphor for numbers; nonstop play back.
- Sketch #4.1-R3 – Same as Sketch 4, but with the audio legend in the beginning of each section
- Sonification-Sketch#4.1-R3.wav
- Sketch #4.2-R3 Similar to Ketch 4, nonstop playback with audio legends overlapped in the beginning of each section
- Sonification-Sketch#4.2-R3.wav
- Sketch #4.3 - Same as Sketch 4.1, but with no background sound
- Sonification-Sketch#4.3-R3.wav
Sketch #5-R3 – Audio legend is placed in the beginning of each section; different sounds were used to represent each section, with the duration being a metaphor for size; sections are presented in pairs to help compare them; sectioned play back
Sketch #6-R3 – Audio legend is placed in the beginning of each section, but is considered part of the sonic chart; only one sound is used to represent the market share, and the sections are represented by echoed legend; a sound was added to represent ten units; the market share sound gets faster as the sections gets smaller; nonstop play back
Sonification Stacking Experiments
Some early and rough experiments with stacking sounds.
Experiments with Percussive Sounds and Legend Placement
Stacked percussive sounds (right justified), no legend
Stacked percussive sounds (right justified), with legend
Sequential percussive sounds with integrated legend
Sequential percussive sounds with integrated legend and "backdrop" sound
Sequential percussive sounds with legend up front
Sequential percussive sounds with single "backdrop", no legend
Some thoughts:
- how can some of these be combined in different ways to offer the user a fuller experience of the chart/data?
- are the pauses between percussive sounds too long? what level of accuracy do we need in terms of correlating duration with values?
- the "backdrop" sound which indicates the full duration of the chart is quite long when it runs for the total length (sum of all parts) - in this example I have shortened it arbitrarily but made it consistent in each part such that it provides an indication of relative length of each section to total
- if the legend is integrated, is it better to use the same sound for all parts? need to consider consistency if different presentations are combined (i.e. maintain unique sound for each section)
| Section |
|---|
Single soundSingle sound, integrated legend (ordered largest to smallest) Single sound, integrated legend (duration to value).mp3 Single sound, integrated legend (frequency to value).mp3 Single sound-density to value-integrated legend.mp3 DensityDensity-to-value-mapping zoomed out
Density-to-value-mapping zoom in 1X
Density-to-value-mapping zoom in 2X
Density-to-value-mapping zoom to units
Density-to-value-mapping zoom to units octave change
Stacked Right with Units - Pitch and Timbre
Stacked right, units, pitch + timbre
Stacked right, units, pitch only - strings
Stacked right, units, pitch only - clarinet
Stacked right, units, timbre only
Combinations - Stacked + Sequentialto do!
|